Article
Maximizing Website Performance: A Comprehensive Guide to Using Google's PageSpeed Tool

Introduction
In today's digital age, website performance is a critical factor for online success. Slow-loading websites can lead to frustrated users, high bounce rates, and lower search engine rankings. To address these issues, Google offers a valuable tool called PageSpeed Insights. In this blog post, we'll explore how to use Google's PageSpeed tool to test your website and the importance of various metrics it provides.
What is Google PageSpeed Insights?
Google PageSpeed Insights is a free online tool that evaluates the performance of your website on both desktop and mobile devices. It provides a detailed analysis of your website's loading speed and offers suggestions for improvement. By following the recommendations provided by PageSpeed Insights, you can enhance user experience, boost SEO rankings, and increase the overall efficiency of your website.
Using PageSpeed Insights
1. Accessing PageSpeed Insights:
- Visit the PageSpeed Insights website (https://developers.google.com/speed/pagespeed/insights).
- Enter the URL of the webpage you want to analyze.
2. Understanding the Metrics:
- Performance Score: This is a crucial metric that reflects your website's overall performance. It's measured on a scale of 0 to 100, with higher scores indicating better performance.
- Largest Contentful Paint (LCP): LCP measures the time it takes for the largest content element (e.g., an image or video) to become visible to the user. Google recommends achieving an LCP of 2.5 seconds or less for a good user experience.
- First Contentful Paint (FCP): FCP measures the time it takes for the first piece of content to appear on the screen. A fast FCP contributes to a better user experience.
- Cumulative Layout Shift (CLS): CLS assesses the visual stability of your webpage. It quantifies how often elements on the page shift unexpectedly, which can be frustrating for users.
- Total Blocking Time (TBT): TBT measures the amount of time during which the main thread of your page is blocked and unable to respond to user input. A low TBT is essential for a responsive website.
- Time to Interactive (TTI): TTI measures when a webpage becomes fully interactive. Users should be able to engage with your site within a few seconds of loading.
3. Interpreting the Results:
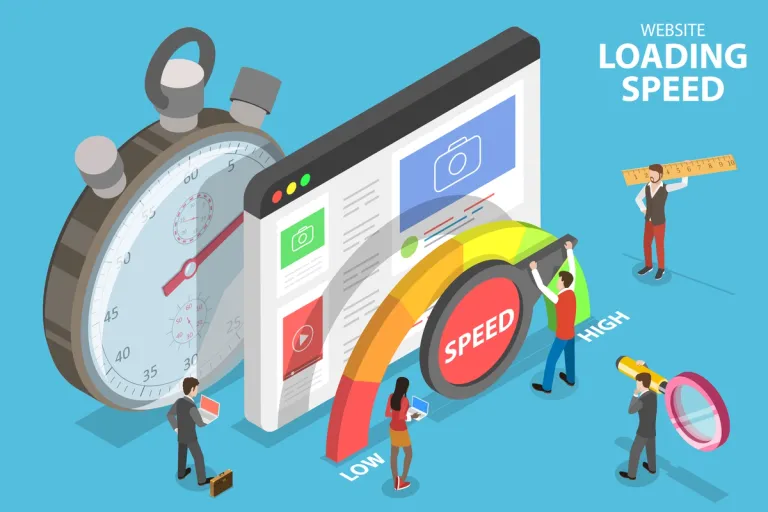
- Green Zone (90-100): A performance score in this range indicates that your website is well-optimized and likely provides an excellent user experience. However, there is always room for improvement.
- Orange Zone (50-89): This range suggests that your website needs some optimization. Pay attention to specific metrics to identify areas for improvement.
- Red Zone (0-49): A score in this range indicates significant performance issues that require immediate attention. Your website is likely frustrating users and may have a negative impact on SEO.
Recommendations
If your website's performance score in any metric is not in the green zone you should contact us. Firefly Software specializes in optimizing web performance, ensuring your website not only loads quickly but also provides a seamless and enjoyable user experience. Don't wait until poor PageSpeed scores start affecting your business; reach out to Firefly Software today to transform your website's performance and maximize the effectiveness of your online presence.
Conclusion
Google's PageSpeed Insights is an invaluable tool for website owners and developers to enhance website performance. By understanding the various metrics and their importance, you can make data-driven improvements that lead to faster loading times, improved user experiences, and higher search engine rankings. Regularly testing and optimizing your website with PageSpeed Insights is a key step in ensuring your online presence remains competitive in today's digital landscape.